Already a customer? Login here
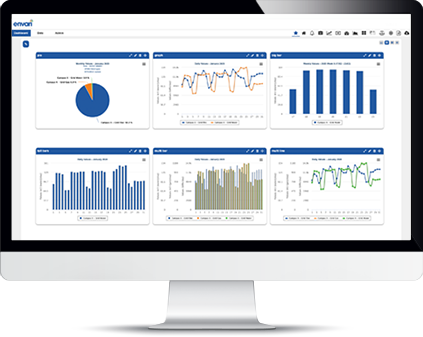
Ever wish you could see all your energy data in one place?
Now you can.
No more juggling multiple spreadsheets or rummaging through pages of raw data. Now, you can consolidate, compare and benchmark data for multiple utilities (including gas, water and electricity) across multiple sites.
Are you constantly searching for data and wasting valuable time?
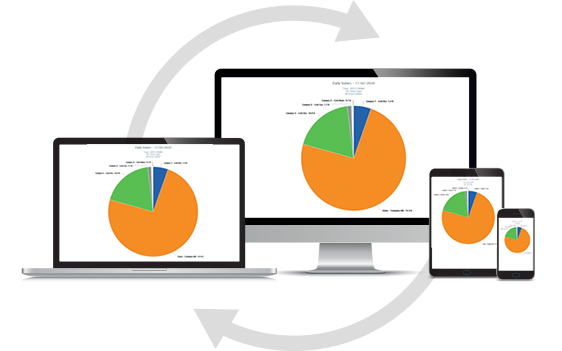
With our cloud-based software (SaaS), all the information you need is at your fingertips.
Multi-device usability allows you to access real-time data anytime and anywhere, while maintaining security protocols and adhering to privacy policies. Now you can safely access data on your computer, laptop or mobile device without having to update any software.
Does tracking trends and comparing historical analysis seem daunting?
Welcome to your simple, customizable solution.
Our sophisticated analytics engine works hard so you don’t have to. It compares your energy against expected patterns and automatically alerts you when something appears abnormal or exceeds pre-set thresholds. Whether you are interested in comparing data from week-to-week, month-to-month or year-to-year; all your energy data is easily accessed and displayed for you in real time.

Looking for an easier way to gather and submit your data for EWRB?
Envari’s Energy Dashboard makes it easy.
The Province of Ontario’s Energy and Water Reporting and Benchmarking (EWRB) regulation is designed to help building owners and managers improve their building’s energy and water efficiency by comparing usage data from similar buildings. Gathering the data and reporting, however, can be a tedious effort which can make the process stressful and time consuming.
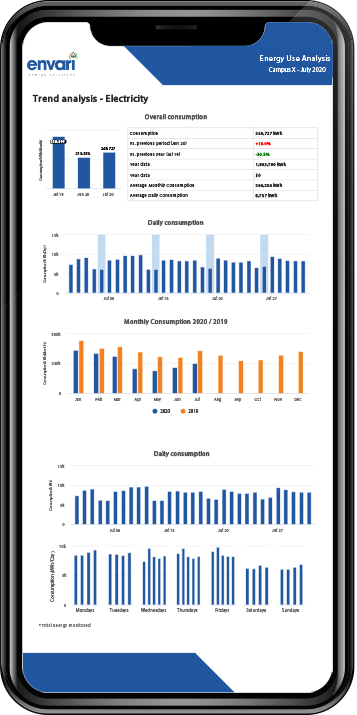
The Envari Energy Dashboard gathers and consolidates the data you need to complete your EWRB Reporting effortlessly for all your utilities. It’s the one tool that makes EWRB submissions quick, simple and hassle free.

How is your building portfolio performing from day to day?
You may not know. But you should.
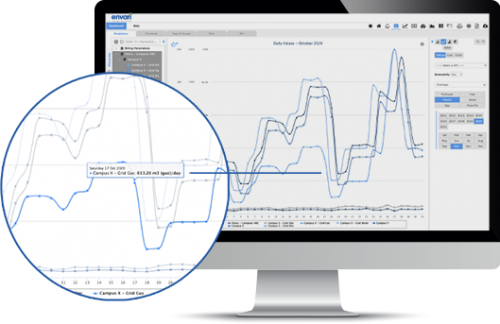
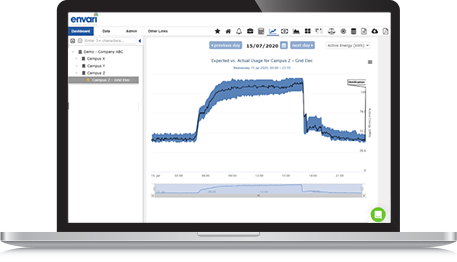
Envari’s technology is always on. It’s busy monitoring your energy data for you and generating real-time alerts with automated emails. It identifies problems and prompts you to take action.
Ever imagine that you could predict the future?
With machine-learning analytics, now you can.
Maximize efficiencies as you view consumption heat maps, pinpoint issues and identify areas of poor performance. By applying linear regression and predictive analysis, you’ll be able to easily identify opportunities to reduce energy, reduce waste, reduce CO2 and increase savings.

How fast are you getting custom reports?
Probably not this fast.
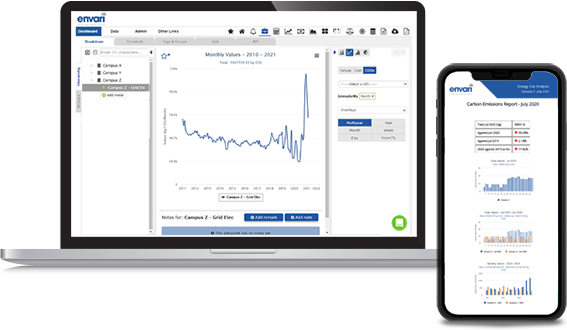
Reports can be downloaded on demand. Now, you can import and export raw data and view real-time statistics with increased granularity. The Envari Dashboard turns utility data into valuable insights that can be shared with stakeholders through customized reports sent directly to their inboxes.
Isn’t becoming sustainable a huge undertaking?
Not anymore.
Create a Climate Action Plan to reduce your carbon footprint. Track, calculate, and report CO2 and other GHG emissions. Leverage our sophisticated data analytics platform to report savings and support your green building, energy management certifications (i.e., LEED and BOMA).

Are your needs out growing your capacity?
Our technology integrates easily with other software systems, platforms and meter types.
Now you can embed analytic modules into other online dashboards or platforms and use the API to activate new, powerful insights. You can also add metering points for lighting, building automation and more. Envari’s Energy Dashboard gives you the ability to seamlessly add/change users in your organization. It’s simple, intuitive and easy to use.
Let Envari simplify the integration process for you.
Book a Demo

Save time and money with one of the most powerful tools to manage your energy budget.
Features at a glance:
Visualization
- Multi-Purpose Data Visualization
- Live and Historical Meter Data
- Interactive Note Conversations
- Facility Schedule, Weather & Event Overlays
- Custom Widgets
- Public Custom Lobby Display Dashboard
- Consumption Heat Maps
Analytics
- Machine-Learning Trend Analytics
- Portfolio Benchmarking & KPI Metrics
- Real-Time Analysis
- Tariff Analysis
- Power Quality Analysis
- Peak Demand Finder
- Energy Savings Project Tracking
- Weather & HDD/CDD Normalization
Data
- Data Granularity – Down to 5 Min Intervals
- Virtual Meter Creation
- Unlimited Historical Data Storage
- Data Exports – Manual, FTP, API
- Scheduled FTP Data Exports
- Hardware Agnostic Data Imports
Management
- Unlimited Quantity of Users
- Customize User Profiles and Access
- Monitor User Edit History
- Custom Email Alerts & Event Notifications
- Embed External Applications/Pages
- Interactive Map View
- Mobile Browser Support
- Envari Technical Support
- Quarterly Software Enhancements Reporting
Reporting
- Utility Bill Auditing & Verification
- Utility Bill Parsing
- Measurement & Verification (Linear Regression Modelling)
- Energy Consumption & Cost Savings Reports
- Custom Automated Daily/Monthly Reports
- CO2 & GHG Reporting
- Property & Tenant Utility Reporting

